Every spring after all the snow melts, cities, towns and states make plans to remedy the devastation snowplows and chained tires generate on their roads. As road-repair budgets are weighed by cash strapped states, we decided take a closer look at data compiled by others and determine who had the worst roads in the country.
Four metrics were analyzed to do this. Each state was ranked on each indicator and the results pooled to generate a cumulative ranking for all 50 states. Washington, D.C. was left out, and avoided bringing money into the equation at all. Road maintenance expenses tell us nothing more than how much money was spent on road repairs. States that spent the most on their roads could be assumed to have the worst (the more repairs are needed, the more money will be spent), but may also be considered to have the best roads (more money spent on roads means, well, better roads).
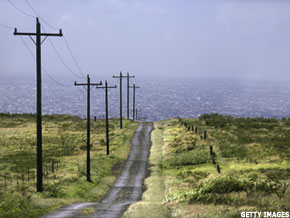 |
| After a rough winter, road repair budgets are being weighed by cash strapped states. Although, Hawaii, in a tie for 8th place despite having the smallest road system in the country – must place the blame elsewhere. |
The factors looked at include:
- Poor-condition mileage.To compare the percentage of each state’s roads deemed to be in “poor condition” - used 2008 numbers put together in a comprehensive report by the Reason Foundation. We combined the rankings for rural interstates, urban interstates and other rural and urban roads to get a unified ranking for road condition.
- Deficient or obsolete bridges.Because bridges and overpasses make up an important part of roads everywhere, we looked at 2009 bridge condition data from the Department of Transportation’s Federal Highway Administration.
- Fatalities.To get an idea of road safety, we looked at the number of road fatalities per state in 2009 — measured per 100 million vehicle miles traveled to account for the different lengths of road in each state — from the Federal Highway Administration.
- Congestion.We again used the Reason Foundation’s calculations to determine peak-hour volume-to-capacity ratios on each state’s roads.
And now the rankings:
Tenth-worst roads: Alabama
Poor-condition mileage rank (1=worst): 29 out of 50
Deficient bridges rank (1=worst): 25 out of 50
Fatalities rank (1=most): 9 out of 50
Congestion rank (1= worst): 12 out of 50
Alabama kicks off our list with the worst rankings for fatalities and congestion. That partially explains why the state got less money than most, per capita, from the Federal Highway Fund in 2009 ($18.50 per resident, or 32 out of 50 states), as the state’s roads and bridges are in decent shape, comparatively — Alabama placed in the better half of both of those rankings.
Ninth-worst roads: Kentucky
Poor-condition mileage rank (1=worst): 44 out of 50
Deficient bridges rank (1= worst): 14 out of 50
Fatalities rank (1=most): 7 out of 50
Congestion rank (1= worst): 8 out of 50
Kentucky is somewhat similar to Alabama in its combined scores: Bridges aside, the state’s roads are in good condition, but its levels of traffic and road fatalities in 2009 — both within the 10 worst in the nation — give it the ninth-worst roads in the country.
The state is taking the problem seriously: The Kentucky Department of Transportation’s impressive website puts the focus on safety with videos from the federal Department of Transportation’s “Faces of Distracted Driving” awareness project.
Eighth-worst roads (tie): Pennsylvania
Poor-condition mileage rank (1=worst): 21 out of 50
Deficient bridges rank (1= worst): 2 out of 50
Fatalities rank (1=most): 21 out of 50
Congestion rank (1= worst): 27 out of 50
Leading off a three-way tie for eighth place is Pennsylvania, a state that really needs to do something about its bridges.
At least the state recognizes the problem: The vast majority of Pennsylvania Department of Transportation projects involve bridge repairs of some kind. With middle-of-the-road rankings in our other three metrics, the right improvements should do wonders for next year’s rankings.
Eighth-worst roads (tie): New Jersey
Poor-condition mileage rank (1=worst): 2 out of 50
Deficient bridges rank (1= worst): 16 out of 50
Fatalities rank (1=most): 47 out of 50
Congestion rank (1= worst): 6 out of 50
Despite the tolls New Jersey collects on its stretch of Interstate 95, also known as the New Jersey Turnpike, the state is fighting a losing battle to maintain its heavily traveled arteries.
Its interstates take a beating all year from huge volumes of traffic, with the only upside being a low level of road fatalities that may be explained in part by lower speeds to which drivers are limited.
Eighth-worst roads (tie): Hawaii
Poor-condition mileage rank (1=worst): 13 out of 50
Deficient bridges rank (1= worst): 3 out of 50
Fatalities rank (1=most): 39 out of 50
Congestion rank (1= worst): 16 out of 50
Blame it on the corrosive sea air or volcanic activity, but Hawaii’s roads — and certainly its bridges — leave much to be desired. The state has the smallest road system in the country , with a mere 4,371 rural and urban roads under state control. In 2009, Hawaii unveiled a “Comprehensive Six-Year Highways Modernization Plan” allocating $90 million to rehabilitating the state’s bridges, an increase of 48% from the previous bridge program budget.
Fifth-worst roads: Arkansas
Poor-condition mileage rank (1=worst): 10 out of 50
Deficient bridges rank (1= worst): 32 out of 50
Fatalities rank (1=most): 5 out of 50
Congestion rank (1= worst): 22 out of 50
At No. 5 is Arkansas, whose 10th-highest percentage of roads in poor condition probably has something to do with its fifth-highest level of road fatalities in 2009. Thankfully the state is able to throw some money at the problem; its funds allocated per capita ranked 11th in the nation in 2009.
Fourth-worst roads: West Virginia
Poor-condition mileage rank (1=worst): 12 out of 50
Deficient bridges rank (1= worst): 6 out of 50
Fatalities rank (1=most): 4 out of 50
Congestion rank (1= worst): 43 out of 50
West Virginia, despite being able to boast very low levels of traffic congestion, ranks disturbingly high for fatalities and for the poor condition of its roads and bridges. The state’s Department of Transportation website makes little mention of these problems, but a multimedia section on it includes an instructional video on how to properly navigate a roundabout. Perhaps authorities think lack of knowledge by West Virginia drivers will help improve road safety in the state.
Third-worst roads: Oklahoma
Poor-condition mileage rank (1=worst): 3 out of 50
Deficient bridges rank (1= worst): 13 out of 50
Fatalities rank (1=most): 11 out of 50
Congestion rank (1= worst): 34 out of 50
More than 400 miles of iconic Route 66 is within its borders, but Oklahoma has not benefited from the road’s historic status to attract more money to its road system. It logs the third-highest amount of poor-condition mileage in the U.S., while its bridges rank 13th. Fatalities are also a problem in the Sooner State, but the authorities are at least addressing the problem directly, with a 2009 report on road safety that includes pictures of the worst stretches of its roads.
Second-worst roads: North Carolina
Poor-condition mileage rank (1=worst): 16 out of 50
Deficient bridges rank (1= worst): 10 out of 50
Fatalities rank (1=most): 18 out of 50
Congestion rank (1= worst): 9 out of 50
The runner-up in the ranking goes to North Carolina, with no standout numbers beyond the picture they paint as a whole: The state places in the worst 20 for all of the indicators, with numbers for deficient bridges and congestion placing in the 10 worst. It might be hard for the state to address its problems too, as it ranks 44 out of 50 states for per capita fund allocation from the Federal Highway Fund .
On the plus side, a new program from the North Carolina Department of Transportation to install solar panels to power its airport should free up some cash for much-needed road repairs.
Worst roads: Louisiana
Poor-condition mileage rank (1=worst): 8 out of 50
Deficient bridges rank (1= worst): 12 out of 50
Fatalities rank (1=most): 2 out of 50
Congestion rank (1= worst): 23 out of 50
Nobody can doubt Louisiana has had a rough decade. Hurricanes were part of the problem. The material damage and complications of evacuation and reconstruction put additional stress on the road system.
But the state ranked No. 2 in fatalities in 2009 (after Montana), combining with high marks for poor-condition roads and bridges to give it the dubious honor of having the worst roads in the nation.
One ray of sunlight is that the feds have responded with extra cash: Louisiana ranks eighth out of 50 states for money allocated to it by the Federal Highway Fund ($54.31 per capita), so there should be continued progress on rehabilitation of those roads.
What are the worst roads you've driven??
Comments